Compact and Intuitive Data-Driven BRDF Models
(Image Comparison)
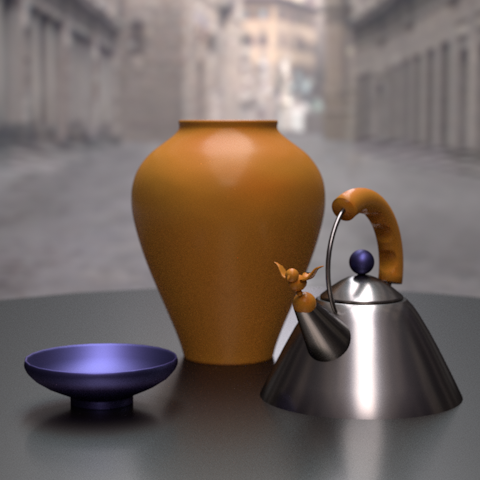
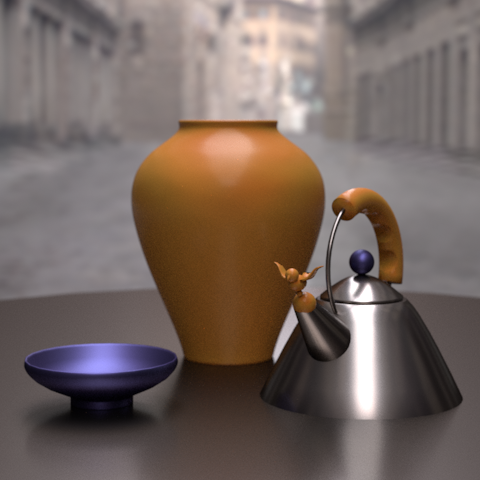
Below we compare our factored BRDF model against the reference image, Edwards et al.'s [2006] BRDF model, Lawrence et al.'s [2004] BRDF model and Bilgili et al.'s [2011] BRDF model. We also visually show the effect of adjusting the L term (i.e., the number of iterations) in our factored BRDF representation. For higher disparity, the color-coded difference images are scaled by 5. Furthermore, we show BRDF reconstruction results from the factor measurements. Finally, we show the visual comparisons of well-known BRDF parameterizations (PDV, Half-Out, Half-Diff), the factorized BRDFs by the CPD method with 1 and 10 iterative terms, the 2D BRDFs factorized by the CPD method.
◄ back to the publication web page
Jump to comparisons:
Comparison of our BRDF representation with various L terms
The visual comparisons of our factored BRDF representation with various L parameters. The scenes were rendered at 262144 samples / pixel:
.png)
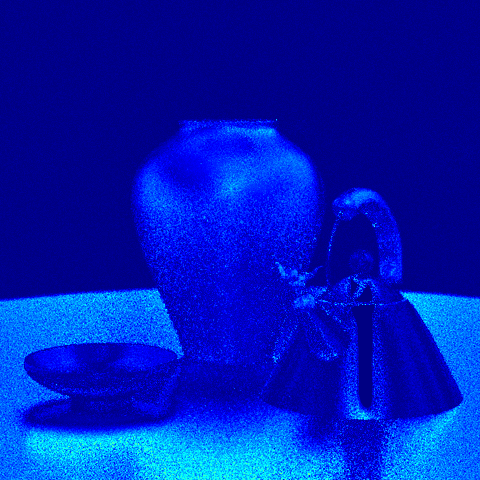
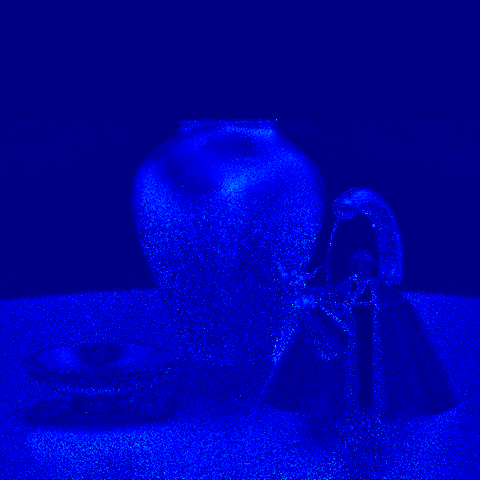
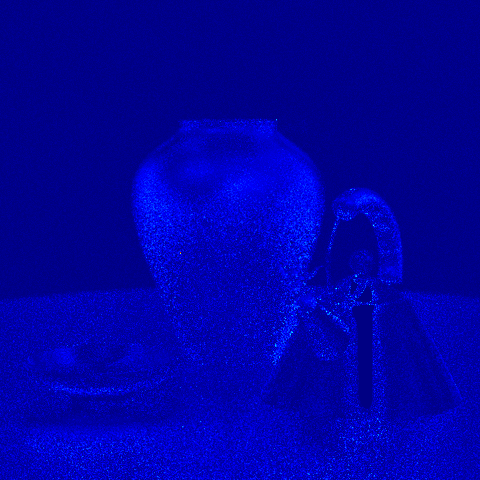
Comparison of difference images with various L terms
The visual comparisons of the color-coded difference images of our factored BRDF representation with various L parameters:
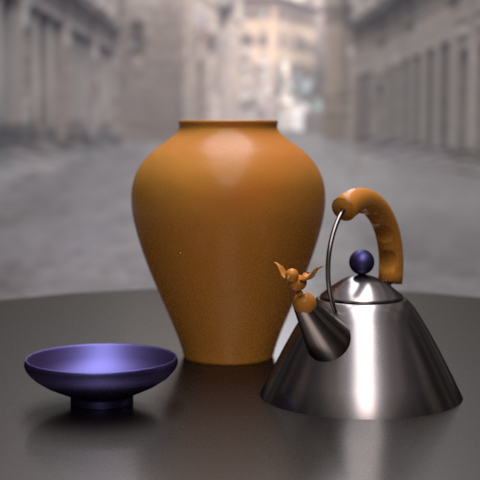
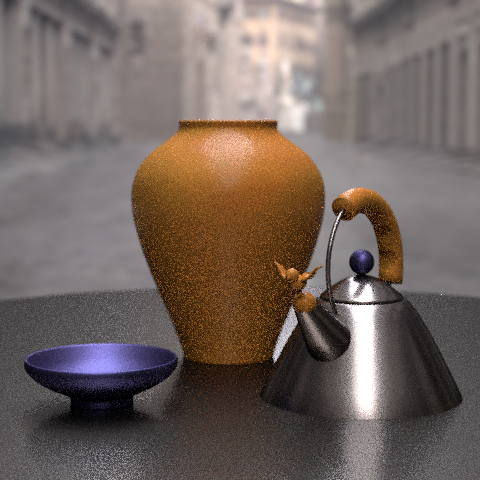
Comparison of BRDF representations
The reference image was rendered at 262144 samples / pixel:
The visual comparisons of well-known BRDF representations. The images were rendered at 262144 samples / pixel:
![Edwards et al. [2006]](ParamBRDFcomparisonv2/DaveEdwardsEdwardsThreeSpecLobeWithSampling(512x512).png)
![Lawrence et al. [2004]](ParamBRDFcomparisonv2/DaveEdwardsLawrenceImportanceSampling(512x512)1.png)
![Bilgili et al. [2011]](ParamBRDFcomparisonv2/TuckerPrinceton(512x512)1.png)
Comparison of difference images
The visual comparisons of the color-coded difference images of well-known BDRF representations:
![Edwards et al. [2006]](ParamBRDFcomparisonv2/DaveEdwardsEdwardsThreeSpecLobeWithSampling(512x512)_diff.png)
![Lawrence et al. [2004]](ParamBRDFcomparisonv2/DaveEdwardsLawrenceImportanceSampling(512x512)_diff.png)
![Bilgili et al. [2011]](ParamBRDFcomparisonv2/TuckerPrinceton(512x512)_diff.png)
Comparison of sampling efficiency
Side-by-side comparison. The images were rendered at 256 samples / pixel:
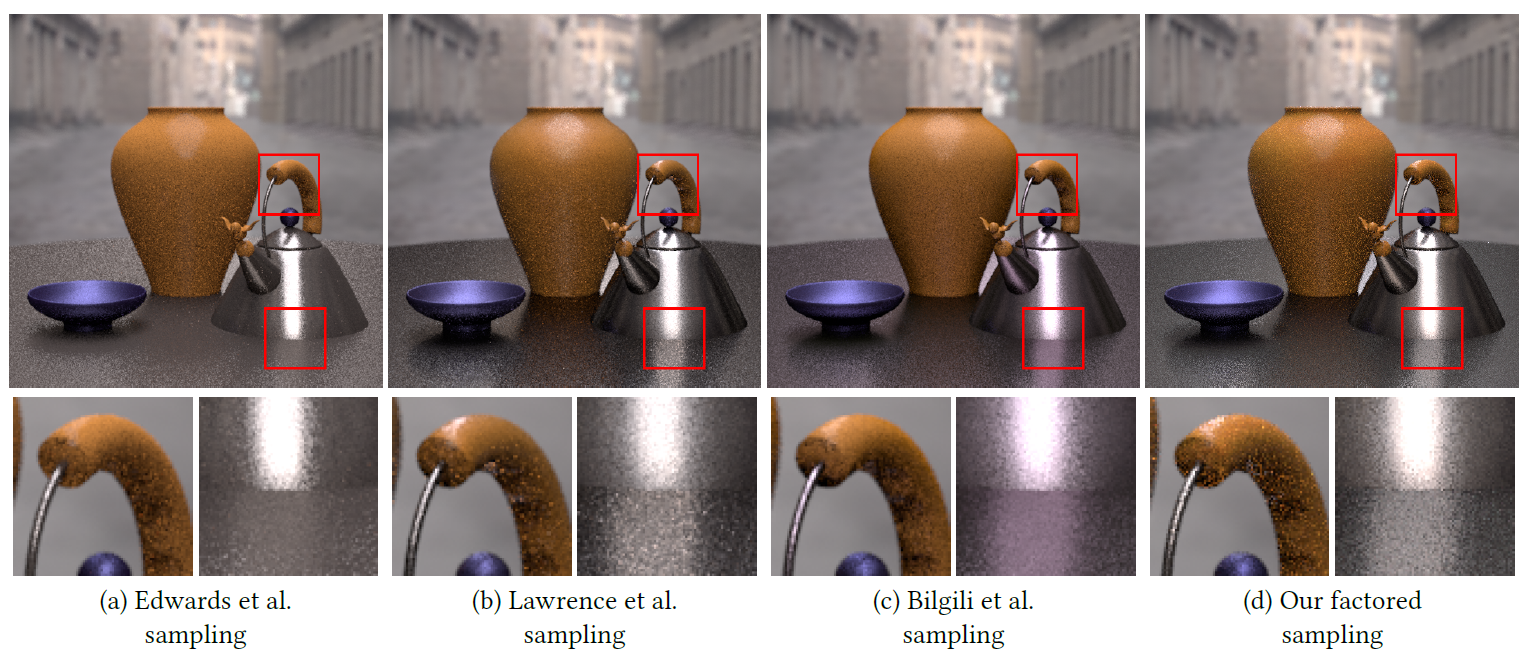
The visual comparisons of the sampling efficiency of well-known BRDF representations:
![Edwards et al. [2006]](ParamBRDFcomparisonv2/DaveEdwardsEdwardsThreeSpecLobeWithSampling(16x16).png)
![Lawrence et al. [2004]](ParamBRDFcomparisonv2/DaveEdwardsLawrenceImportanceSampling(16x16).png)
![Bilgili et al. [2011]](ParamBRDFcomparisonv2/TuckerPrinceton(16x16).png)
Comparison of BRDF reconstructions
The separability of the PDV parameterization is useful in BRDF measurements. We can reconstruct BRDFs by using only measurements of two parameters (θr and dp) as the Φp parameter is assumed to have little variance on isotropic BRDFs. When specular lobe measurements are captured for the function describing θr parameter, the dp parameter is described by the measurements from a fixed angle of θr. The visual comparisons of BRDF reconstructions from the factor measurements can be seen in the following link:
Comparison of BRDF parameterizations
A general overview of well-known BRDF parameterizations:
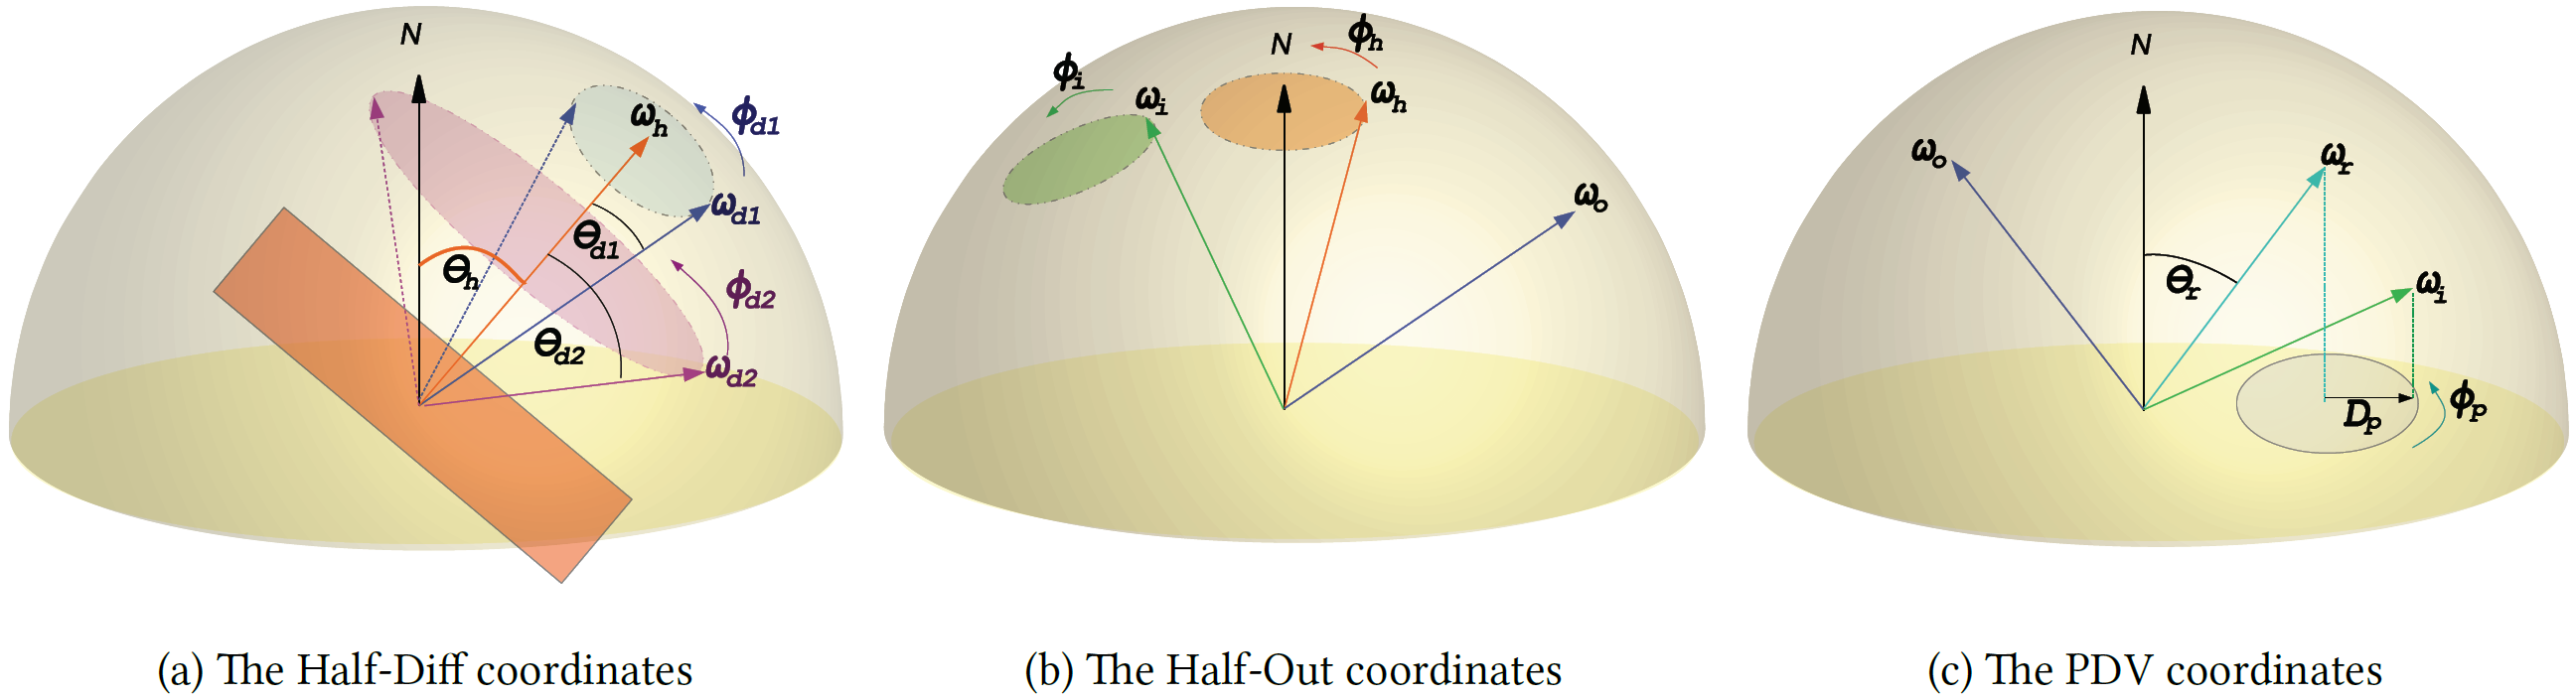
The visual comparisons of well-known BRDF parameterizations (PDV, Half-Out and Half-Diff), the factorized BRDFs by the CPD method with 1 and 10 iterative terms, the 2D BRDFs factorized by the CPD method can be seen in the following link. In the following link, each row represents rendering in each parameterization and compares against its factorized BRDF. The second and fourth columns of the rendering represent the factorized BRDFs by the CPD method with 1 and 10 iterative terms respectively. The sixth column represents the 2D BRDFs factorized by the CPD method. The third, fifth and seventh columns show the heat maps of the errors between the reference and each estimated BRDFs: